Exercises on numpy array
Squared numbers
Create a list (using a loop) and an array (without loop) containing the square of integer number from 0 to N-1. Compare execution speed with  .
.
Solution
On can use the time module te precisely measure the speed
from time import time
from numpy import *

t0 = time()

list_square = []
for i in range(1000000):
    list_square.append(i**2)

t1 = time()

array_square = arange(1000000, dtype=int64)**2

t2 = time()

print "Duration with a list   :", t1-t0
print "Duration with an array :", t2-t1
Calculation of pi
Without any loop, calculates  using the formula :

Take care of the integer division in the 2.7 version of Python.
Solution
N = 34
Tk = arange(N, dtype=float64)

print sqrt(12)*sum((-1)**Tk / (3**Tk*(2*Tk+1)))
Which value to choose for N ? The relative precision of 64 bits float is
 . We can stop the sum if
 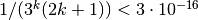 .
This is the case for
.
This is the case for
 .
.
Allan variance
The allan variance of a set of measurements  , where each point corresponds to a frequency measured during
  is defined as :

- Write a function that calculates the Allan variance without any loop
Using a data set where the duration of each measurement is  , it is possible to calculate the Allan variance for duration
  that are mutiple of . In this case, the new value is calculated by taking the average value of
  consecutive measurements. There is no overlap between the values (there is times less points compared to the initial set).
- Write a function average_frequency(data, n) that calculate the mean value of data with packets of size n.
It is possible to make this function without any loop. Let us start with an array of size 10 and take  . The shape of the array is initially:
+--+--+--+--+--+--+--+--+--+--+
|x0|x1|x2|x3|x4|x5|x6|x7|x8|x9|
+--+--+--+--+--+--+--+--+--+--+
Using the rechape method (x.reshape((5,2))), the array will look like:
+--+--+
|x0|x1|
+--+--+
|x2|x3|
+--+--+
|x4|x5|
+--+--+
|x6|x7|
+--+--+
|x8|x9|
+--+--+
The method mean(axis=1) will perform the average line by line.
- Write the function AllanVariance(data, n) that calculate the Allan variance for a measurement duration of
 .
.
Solution
def average_frequency(data, n):
    """ moyenne les valeurs de data par paquets de taille n"""
    databis = data[len(data)%n:]
    return databis.reshape(len(data)//n, n).mean(axis=1)

def AllanVariance(data, n):
    """Variance d'Allan

    Calcul la variance d'Allan du tableau data en regroupant les mesures par
    paquets de taille n
    """
    y = average_frequency(data, n)
    return  ((y[1:] - y[:-1])**2).mean() /2
Mandelbrot set
The Mandelbrot set is defined as the set of points  of the complex plane such that the following sequence :
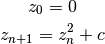
is bounded.
One can show that if there is a value of such that  the the sequence is divergent. To calculate the Mandelbrot set, for each value of one calculate 100 iterations. The picture is plotted by giving to each point the smallest value of
  such that (and 0 if this value doesn’t exist).
Calculate and plot the Mandelbrot set for such that  and
and  . One can then zoom on the edge of the set.
Note : to plot an image, use the imshow function of pylab.
The total computation time using numpy efficiently is less than 10 seconds for a 1024x1024 matrix.

Solution
Three different method are used : using numpy functions, using the vectorize function and using the numexpr package (multi CPU).
x_min, x_max = -2.13, 0.77
y_min, y_max = -1.13, 1.13

N = 1024

def mandel_numpy(x_min, x_max, y_min, y_max, N):
    """ Mandelbrot using numpy """
    x = linspace(x_min, x_max, N)
    y = linspace(y_min, y_max, N)*1j

    c = x + y[:,None]

    image = zeros((N,N))

    z = 0
    for i in range(100):
        z = z**2 + c
        ind = (abs(z)>2) & (image==0)
        image[ind] = i

    return image

def _mandel_suite(c):
    z = 0
    for i in range(100):
        z = z**2 + c
        if abs(z)>2:
            return i
    return 0

mandel_suite = vectorize(_mandel_suite)

def mandel_vectorized(x_min, x_max, y_min, y_max, N):
    """ Mandelbrot set using vectorize from numpy """
    x = linspace(x_min, x_max, N)
    y = linspace(y_min, y_max, N)*1j

    c = x + y[:,None]

    return mandel_suite(c)

import numexpr as ne
def mandel_numexpr(x_min, x_max, y_min, y_max, N):
    """ Mandelbrot set using the numexpr package"""
    x = linspace(x_min, x_max, N)
    y = linspace(y_min, y_max, N)*1j

    c = x + y[:,None]

    image = zeros((N,N))

    z = 0
    for i in range(100):
        z = ne.evaluate('z**2 + c')
        ind = ne.evaluate('(z.real**2+z.imag**2>4) & (image==0)')
        image[ind] = i

    return image

t0 = time()
mandel_numpy(x_min, x_max, y_min, y_max, N)
print "Numpy :", time()-t0
t0 = time()
mandel_vectorized(x_min, x_max, y_min, y_max, N)
print "Vectorize :", time()-t0
t0 = time()
mandel_numexpr(x_min, x_max, y_min, y_max, N)
print "Numexpr :", time()-t0
Benchmark on a Intel(R) Core(TM) i5-3570K CPU @ 3.40GHz Numpy : 2.36773109436 Vectorize : 6.50940179825 Numexpr : 0.899597883224